REPORTING
The AppColl® Reports Module allows users a convenient place to store all reports and views.
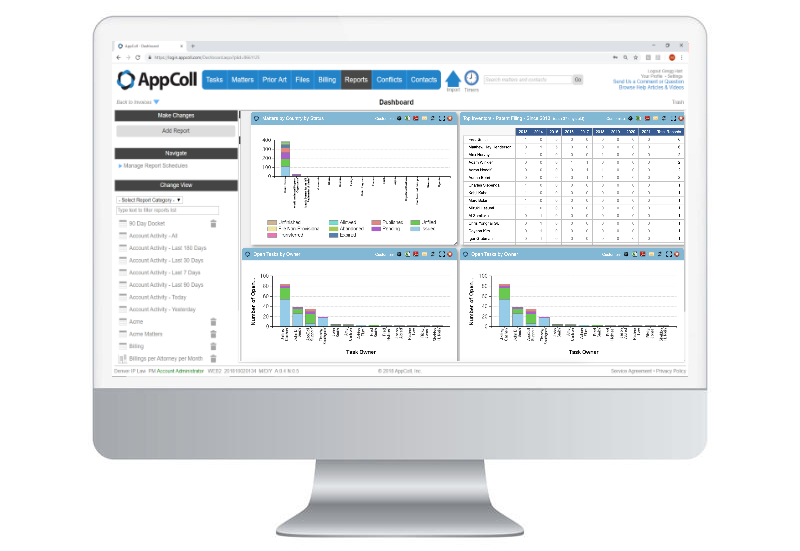
Generate unlimited and customizable bar, graph and pie charts aggregating your data for advanced reporting. Some examples include: number of disclosures filed per inventor per month, percentage of disclosures that convert to patent application filed per product line, number of issued patents per country, average time from disclosure submission to filing by law firm, and invention awards per inventor per year.
Drag, drop and resize charts to customize your dashboard reporting view. Automatically schedule reports to be emailed to numerous parties.
AppColl allows you to customize how you view and receive reports. Set up reports to send automatically based on day, time, client, format, etc.
All reports are based off saved database queries. Always have up to date reports at the click of a mouse.
The Reports Module gives users flexibility to customize their reports using different formats and notification options.
Necessary cookies are absolutely essential for the website to function properly. This category only includes cookies that ensures basic functionalities and security features of the website. These cookies do not store any personal information.
Any cookies that may not be particularly necessary for the website to function and is used specifically to collect user personal data via analytics, ads, other embedded contents are termed as non-necessary cookies. It is mandatory to procure user consent prior to running these cookies on your website.